Sunday, April 18, 2010
Testing project
We tested the projection using the same set up as we would on location, the only differences are that we are obviously not on location, and the light source has come from a strip light and not a traffic light. The project works in the way we planned, and outlined in the previous posts. These movies show our project working from start to finish, Ben is holding the light sensor to the light source, Luke is filming the action, and I am at the controls of the computer this is all running through. The first video below is the groups 'official' final film, which as previously mentioned was filmed and edited by Luke Mears, the second video is a video I took of the first test run. Both clearly show the light sensor triggering the mic sensor linked to the arduino board, which in turn triggers the animation of RSS feeds.
How I hacked the toy
Whilst I was changing the remote from a push button to a light sensor, I decided it would be better to document it on video, rather than writing a boring list of instructions. I feel this should be included as it was a large part of our project, and I worked hard on getting it working. It isn't the best quality video, and may not even be the best quality hack, but I found it both fun and interesting, I owe a great deal of thanks to our lectures for opening my eyes to a way of thinking that had never even occurred to me before. Anyway here is the video which I have posted on YouTube. I hope you enjoy watching it as much as I did making it. J!
The final, final, final project design
Due to some unknown blip in the space time continuum, I am entering this post now, as I believed I had already done so about a month ago. Anyway after the meeting we had as a group to establish what we were going to finally settle on, as a practical doable project idea, we all went away individually and came up with suggestions which we could bring to the table. My idea is stated in a previous post.
When we sat down as a group again certain elements, which had been present all the way through, were obviously set in stone and would not be altered. The main points were that our project was going to be projection based, it was to be based at the 'Old Theatre' location on Union Street, Plymouth, and finally it had to show the bright past of the building along with its modern tragic state. Therefore with that in mind, and everyone's ideas considered, the final project idea took shape.
Using the electronic sound machine, and modifying it so that it is activated through a light sensor, rather than a button press, the remote unit would be placed against the red traffic light nearest to the projection location. When the light turned red, it will activate the remote through the light sensor, and send a signal to the sound unit. This unit will be placed within a sealed unit (i.e. plastic Tupperware box), along with the microphone which is attached to an arduino board, to prevent or limit outside noise accidentally setting off the microphone sensor. When the microphone attached to the arduino board registers a sound, it sends a high reading (1) to the serial port. Along with the arduino, Processing will also be running, and when, and whilst, Processing registers this high reading (1) on the serial port, it will activate the projection.
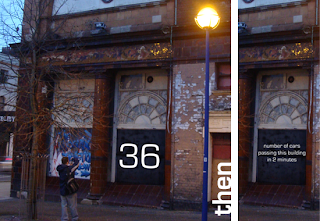
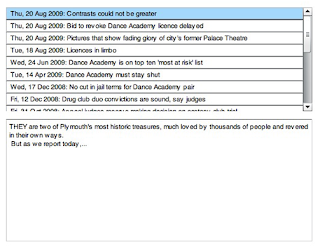
The projection will consist of thought provoking, controversial, messages and text which will be made up partly by RSS feeds taken from thisisplymouth.co.uk, which show the very dodgy recent past of the building as the 'Dance Academy', it will also start and end with the famous red curtains of the theatre to represent it's great history as a theatre. The projection will last slightly longer than the light change so that people do not become bored before it ends, but also they stay long enough to miss the light change and provoke a reaction from what is happening and what they see.
Below are a couple of images which were produced by group member Luke Mears, the first is a visualisation of what it could look like at the location, and the other two are images of the unfinished RSS reader which he is working on.

When we sat down as a group again certain elements, which had been present all the way through, were obviously set in stone and would not be altered. The main points were that our project was going to be projection based, it was to be based at the 'Old Theatre' location on Union Street, Plymouth, and finally it had to show the bright past of the building along with its modern tragic state. Therefore with that in mind, and everyone's ideas considered, the final project idea took shape.
Using the electronic sound machine, and modifying it so that it is activated through a light sensor, rather than a button press, the remote unit would be placed against the red traffic light nearest to the projection location. When the light turned red, it will activate the remote through the light sensor, and send a signal to the sound unit. This unit will be placed within a sealed unit (i.e. plastic Tupperware box), along with the microphone which is attached to an arduino board, to prevent or limit outside noise accidentally setting off the microphone sensor. When the microphone attached to the arduino board registers a sound, it sends a high reading (1) to the serial port. Along with the arduino, Processing will also be running, and when, and whilst, Processing registers this high reading (1) on the serial port, it will activate the projection.
The projection will consist of thought provoking, controversial, messages and text which will be made up partly by RSS feeds taken from thisisplymouth.co.uk, which show the very dodgy recent past of the building as the 'Dance Academy', it will also start and end with the famous red curtains of the theatre to represent it's great history as a theatre. The projection will last slightly longer than the light change so that people do not become bored before it ends, but also they stay long enough to miss the light change and provoke a reaction from what is happening and what they see.
Below are a couple of images which were produced by group member Luke Mears, the first is a visualisation of what it could look like at the location, and the other two are images of the unfinished RSS reader which he is working on.


Final bumper V1.0
Again just a short post and link to my final 30sec bumper about myself. It follows all the ideas laid out in the animatic, which can be found, with a description, earlier on my blog. I am very pleased with the outcome, especially as it was my first true use of AfterEffects, and was also completed ahead of schedule so that if anyone out there over the next few weeks does have any suggestions for improvements, I will be able to improve it.
Anyway I hope you enjoy it as much as I enjoyed making it. It can be found on YouTube, or slightly better quality on my website. Cheers J!
Anyway I hope you enjoy it as much as I enjoyed making it. It can be found on YouTube, or slightly better quality on my website. Cheers J!
Processing final
Only a small post with the link to my final Processing piece which is running on my site.
www.jmmoore.co.uk/processing.html
I hope you enjoy it. J!
www.jmmoore.co.uk/processing.html
I hope you enjoy it. J!
Sketch signing
Applets by comparison are considered untrusted since they are initiated automatically in the browser. This restriction prevents applets from doing certain things, such as loading content from a different domain than the one hosting the applet.
Due to the fact that I am using data from another domain, and that this piece will have to run from my website, I will obviously have to sign the applet. To do this I had to use 'Terminal' on the mac, in the utilities folder which I rarely visit. I had never used this program before so after doing some research online I found these two helpful resources, which with a bit of common sense made this process easy to achieve.
First off was a YouTube video on the general workings of Terminal, then secondly this forum post on the actual process of signing the sketch.
I have also included this picture of my signing just to show where the changes are that I made to make it relevant to my piece.

Processing - Back to the drawing board (almost)
After spending a substantial amount of time trying to deconstruct and understand the 'Flies' sketch, I have come to the decision that I am no longer going to base my sketch around the swarm mechanic. This was due to two main reasons, firstly I feel I haven't spent enough time with 'Processing' to be able to understand how this works, even though I could bend the existing sketch to fit my purpose, and secondly, linked to this point is the fact that to make my sketch work in the way I intended it to I would have to 'borrow' too much of the pre-existing code, and therefore it wouldn't feel, or be my own work.
So after looking back at my original idea, I wanted to find a way I could still achieve that concept with the ability level and skill set I have. I still wanted to use the outside temperature and wind speed to visualise a molecule simulation representation, and still wanted the same governing rules for behaviour, the only difference would be to replace the actual swarm mechanic with something I could achieve myself.
The substitute I settled on was instead of having x amount of particles moving around the stage, I would have them appear, and disappear every couple of seconds so that it isn't just static, and does appear animated. This is achieved simply by adding a count to the draw function, and an if statement so when the count reaches 50 it resets, with a frame rate of 25, this is every 2 seconds. Combine this with the fact that I am doing a representation of molecules, with are basically circles, the simple mechanic both works and is easy to achieve. The rules which apply to the circles is where the simulation steps up a gear.
There are four main attributes which work together to finalise the visualisation. These are, the size of the circles, the position and area these circles take up on the stage, the colour of the circles, and finally the opacity of the circles. The first three are all to do with the temperature outside. Once the temperature is converted into a number Processing can use, it then determines which conditional statement is true, and applies general settings to do with the outside temperature. There are five different possible outcomes, where the temperature between 0℃ and 20℃, is divided into 4℃ ranges, and this affects the colour of the circles, ranging from blue (coldest) to red (hottest), the size of the circles, small for cold, larger for hot, and the area in which they appear, a small grouping in the centre for coldest, and a spread across the whole stage for the hottest. These circles do not appear in set positions, within each conditional statement is built in randomisers which ensure the circles attributes stay within the conditions, but are based on the information from the arch-os and sketch setup, so that each set of fifty 'molecules' are different from the last and not just one of five animations being played.
The final condition of opacity is taken directly from the wind speed. The circles are more opaque the higher the windspeed, and the logic behind this is that even though the temperature maybe 20℃ outside, if you were to look at the circles and they were faint in appearance, there would be high wind outside which adds to the chill, and takes away from the overall temperature.
Even though this may seem overly complicated to explain, I think these attributes add to the final product, and is a much more interesting way of representing the same data rather than just having a blue circle for cold, and a red circle for hot. I wanted it to be based 'loosely' on the way molecules interact whilst heating and cooling, with the more energy (heat) they have the more they disperse. With the colouring and opacity there to add to, and reinforce some points.
The pictures below are from the sketch running and show Plymouth on a hot windy day, and on a cold day with no wind. As you can see I have also added a title, key, and some of the actual data into the sketch. This was for two reasons firstly, I feel it makes the piece look more professional, and secondly, as I have already mentioned I am very practical so I would want a key and title to understand, and show that these appearing circles have a purpose.


Subscribe to:
Posts (Atom)