Wednesday, April 14, 2010

Processing step two and a half

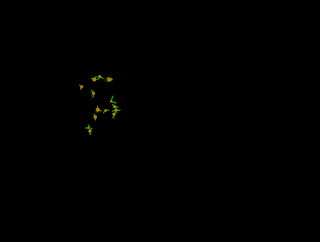
Searching through some more of the sketches I found this sketch to do with flies swarming, funnily called Flies by Elie Zananiri.


I think that if I were to change the flies to coloured particles, were the input is taken from the Arch-os data rather than the mouse input, then the swarming effect that these flies display would be perfect to hang my idea upon.

Tuesday, April 13, 2010

Processing step two

After looking at the data types again I have decided that I would like to take the outside temperature, and the three main inside temperatures, and represent those different data feeds in the style of molecules and particles. This would show how that when the temperature rises, the particles become more energised and mobile, therefore move all over the window in a swarm like fashion, as opposed to when they are colder, where they would have less energy so wouldn't move as much and stay together.

To get an idea of previous examples I visited a site http://www.openprocessing.org/ where there is a large collection of processing sketches. By searching for swarms and particles under their tag system I found a couple of really good, but really out of my league, sketches which show what processing is capable of. First is a sketch called Gravity swarm by Claudio Gonzales. http://openprocessing.org/visuals/?visualID=2363


Secondly is another good example of swarming behaviour called Molecule soup by Stingingeyes. http://www.openprocessing.org/visuals/?visualID=8675

Processing step one

Our project brief was to take the RSS feeds from the Arch-OS system, then using Processing, take some of that environmental data and visualise this in an aesthetic way. The result must also be animated in some way, but have no interactivity.
There are two feeds, a live feed for the data at http://arch-os.scce.plymouth.ac.uk/bms_data.rss and also an archive of past data at http://x2.i-dat.org/archos/archive.rss


The first action I took was to enter the addresses into a browser to see what data types were available. There was basically data which fell into four groups, one for outside of the building, which included geographical data like wind speed and direction, rain fall, and temperatures etc. The other groups were effectively one for each of the three parts of the building, which contained data do to with the interior of the building, i.e. CO2 levels, elec use, and temperature.


I decided that the processing sketch could represent one of two things, literal data, or an abstract realisation of that data. My problem lay with the fact that I am a very literal person, and if asked to use data, I will show data. However this would not be very aesthetic, nor would it fill the brief, so I intend to produce something which fills both camps. To achieve this I propose to do a visual representation of something like a scion experiment or diagram, this will mean it is not just a set of figures, but people will also be able to relate to it. I also would like to use the exterior data due to the fact that it is to be displayed outside, agin so people can relate, and I find the data available for the outside to be more interesting.

Sunday, April 11, 2010

TV bumper rethink

After finishing my animatic for the 30secs bumper about myself, I have decided to make a small change. I was quietly pleased with the outcome, and thought that the comic book styling worked well. However, if I were to use photographs from my past as planed, I believe that all the continuity of the styling would be lost, as I would be mixing both real life images with cartoon illustrations. So to hopefully improve the overall quality of the piece, I have made the decision to replace all pictures which included myself, or my wife, and use the Jay character I created, and a new character to represent my wife, instead. The Jay character has become, and will continue to be, a fundamental part in my own personal online branding and persona, therefore the final piece will also be able to become an exercise in self promotion, should the final quality be as high as expected.

Monday, March 8, 2010

Vids and Pics

Just wanted to point out that I now have my own YouTube channel and Flickr channel where people can view my work, but more importantly to get myself out there and link back to my website.

These links will obviously be two way once I have finished the redesign of my website, and both channels need to be filled out more which takes time.

Stonehouse pragramming test

A few images which show our group working together on test sketches for the Arduino board.


My toy hack

Just a small post to show some work I have started whilst NOT being in New York.
After talking through our ideas as a group we decided it would be best to have a wireless system going from the traffic signal to the Arduino board, rather than simple wires. So a cheap solution was to try and modify an electronic fart machine, which would give us a wireless transmitter and a sound would be produced which could act as the input for the Arduino.

Below are some pictures of the device, along with some test footage I made, just showing the range and parts of the device. I apologize for the quality as was done with mobile phone.